guia gali
Using Concrete Scales
Research ∙ Information Visualization
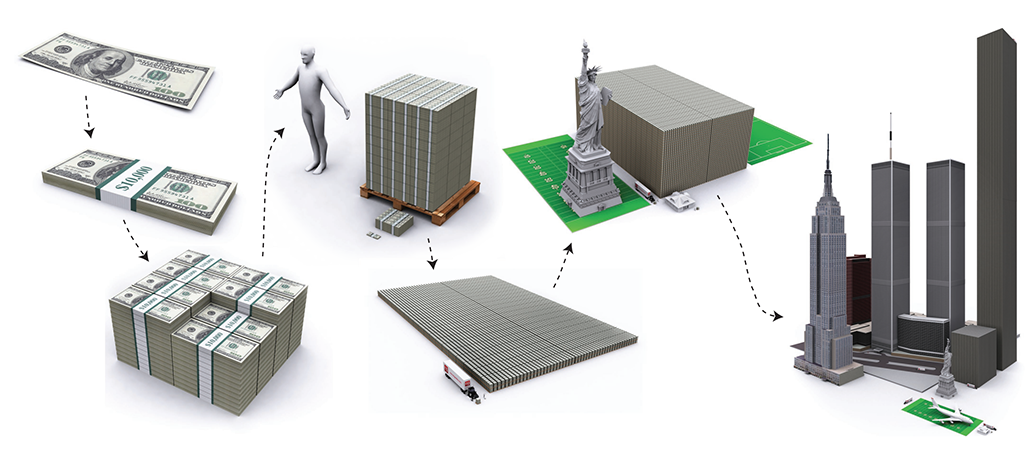
 US Debt (Oto Godfrey, demonocracy.info, 2011)
Abstract
From financial statistics to nutritional values, we are frequently exposed to quantitative information expressed in measures of either extreme magnitudes or unfamiliar units, or both. A common practice used to comprehend such complex measures is to relate, re-express, and compare them through visual depictions using magnitudes and units that are easier to grasp. Through this practice, we create a new graphic composition that we refer to as a concrete scale.
Reference
F. Chevalier, R. Vuillemot, and G. Gali. Using Concrete Scales: A Framework for Visual Depiction of Complex Measures in Proceedings of the Conference on IEEE Transactions on Visualization & Computer Graphics (InfoVis'13), 10 pages, December 2013.
 Examples of graphic composites involving pictorial representations of real objects without notations. (a) The relative size of the orange and sugar cube is preserved (b) The relative size is not preserved (c) The orange is juxtaposed to several sugar cubes (d) Rearranged the cubes to make them easily countable.
 All the water and all the air (A. Nieman, 2010) compares the volume of air and water with that of Earth. All the water on Europa (K. Hand, J. Cook, H. Perlman, 2012) features the volume of water on Earth and Jupiter’s moon Europa.
Next Up: Data Overload: Data-embedded 3D Visualization
View Case Study